#Tractor2Tractor

India Farmer's Protest was in the news in early 2021 for being one of the largest organized protests. The farmer's protest was not only in national news but was also featured internationally by many media outlets. Social Media is the new way to share information, and it's here to stay. Twitter is one such platform where the information travels at a blazing fast speed through replies and retweets. Tweets are instant and easy to make, therefore allowing easy access to the platform.
The protest created a lot of buzz on Twitter. People from both sides of the argument used Twitter to spread awareness among the general public. The issue caught wind when the international popstar Rihana made a tweet recognizing the farmer's protest. The importance of Twitter cannot be understated as the government sought out to ban over 1200 Twitter accounts that were allegedly labelled "Khalistani sympathizers." Tweets from many famous Indian and international celebrities followed. Twitter served as a hub for major information exchange during the protest. Collusion or mass manipulation of content on Twitter is a major problem that hides the general public's opinion behind the coordinated tweeting. In this project, we focus on this problem specific for the #farmersprotest hashtag, studying and reporting the patterns observed while analyzing the collected data.


(Source: https://twitter.com)
Problem Statement
We aim to study the tweets that are related to the Farmer’s protest and different engagement patterns, identifying inorganic data and collusive tweeting by the Twitter users related to this protest in English, Hindi and Punjabi.
Twitter served as a hub for major information exchange during the protest. Collusion or mass manipulation of content on Twitter is a major problem that hides the general public's opinion behind the coordinated tweeting. In this project, we focus on this problem specific for the #farmersprotest hashtag, studying and reporting the patterns observed while analyzing the collected data.
Methodology
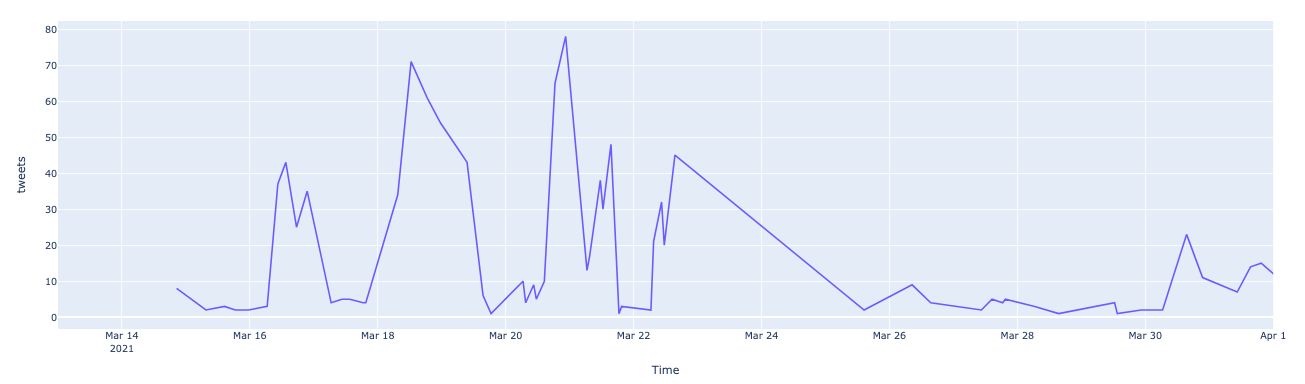
We focussed our study on tweets collected from March 16 to April 1, 2021. We tried to identify malicious users by spotting accounts that posted an unusually high number of tweets in a day or hour. Users with more than the average number of tweets per day were further analysed to find any unnatural patterns. The engagement patterns for each of these users were plotted across time and all possible patterns were observed. Further, these results were correlated with the entire dataset to check the consistency of our observations. This helped us spot possible spam/bot accounts.
Further, we analyzed the overall sentiment of Twitter on the subject matter to check the presence of polarising views and whether these users which were earlier identified as spam/bot are supporting only a particular idea. This was followed by cluster analysis to check the similarity between various tweets’ contexts.
The analysis was concluded by calculating the coefficient of traffic manipulation on different days of the week. This was done to support our claims of the presence of malicious users and inorganic, coordinated activity on Twitter during the farmer’s protest.

Studying User Engagement Patterns
We further plotted the daily tweeting pattern for the selected extreme user. It was observed that many users had extreme Twitter activity and were found to create hundreds of tweets in a single day. For some users, this number was as high as 300. Some examples of the same are shown below. At the same time, these users were active during specific hours of the day. The maximum activity was observed during 7-9 AM for these users. The pattern coincided with the total tweet generation about farmer’s protest. This further helped us confirm the collusive nature of the tweets about Farmer’s Protest.

User Engagement Pattern - English
User Engagement Pattern - Hindi

User Engagement Pattern - Punjabi
Results
While analyzing the overall content generation, similar tweeting patterns were observed across the English and Punjabi languages. The peaks were observed at around 7-8 AM every day and were consistently increasing from March 14 to March 23. There was no data collected for 24th march after which we can see a sharp decline in data generation.

Tweets - Organic or Manipulative?
 The coefficient of Traffic Manipulation (or CTM) is a metric used to measure the relative extent to which the given data has been manipulated. Ben Nimmo proposed the coefficient in his paper "Measuring Traffic Manipulation on Twitter." It combines three different indicators of collusion: percentage of traffic from top 50 users, percentage of retweets and the average number of tweets per user. Ben claims the coefficient can detect collusion attempts regardless of how it was achieved (be it human posters or bots).
C = (R/10) + F + U
R: Percentage of retweetsF: Percentage of traffic from the top 50 usersU: Average Number of Tweets per user
We calculated the coefficient for each day and each language separately to observe the trends(if any). We found the ranges of CTM to be (25-45) for English, (15-45) for Hindi and (45-55) for Punjabi. We excluding March 24th from the analysis due to the lack of sufficient data. These ranges are way beyond what the paper recommends to be collusion free. In his research, Ben found CTM to be under 12 for controlled examples. These ranges indicate a high degree of manipulation for the collected data. Another interesting observation that we can make from the plots provided is that content generation is relatively low for dates after 24th march, but the CTM for English and Hindi increase after 24th march, which might indicate that the users that stopped tweeting were genuine users.
Tweet Clustering
Clustering tweets based on text similarity can present interesting observations if many users plagiarised while writing their tweets or right out copied them. We calculated a feature vector for each tweet by averaging the word vectors obtained. We used a bag of words approach to generate these features. After we generated the features, we used a density-based clustering algorithm to cluster similar tweets. We then used TSNE to visualise the high dimensional data.

In the plot below, you can see three types of data points:- Multiple small island clusters separate from the main island: The data points in these islands coincide, indicating that the same text was used for the tweets.
- One sparsely populated central island: These contain the majority of the points. These are the tweets that showed variation in text and cannot be considered as collusive.
- Dense areas on the central island: These are the regions with dense areas inside the central island. These regions indicate the tweets that were not very different from the rest of the corpus but are too similar. The content might be plagiarised or changed just a bit to avoid detection.
Tweets - Organic or Manipulative?
The coefficient of Traffic Manipulation (or CTM) is a metric used to measure the relative extent to which the given data has been manipulated. Ben Nimmo proposed the coefficient in his paper "Measuring Traffic Manipulation on Twitter." It combines three different indicators of collusion: percentage of traffic from top 50 users, percentage of retweets and the average number of tweets per user. Ben claims the coefficient can detect collusion attempts regardless of how it was achieved (be it human posters or bots).
C = (R/10) + F + U
R: Percentage of retweets
F: Percentage of traffic from the top 50 users
U: Average Number of Tweets per user
We calculated the coefficient for each day and each language separately to observe the trends(if any). We found the ranges of CTM to be (25-45) for English, (15-45) for Hindi and (45-55) for Punjabi. We excluding March 24th from the analysis due to the lack of sufficient data. These ranges are way beyond what the paper recommends to be collusion free. In his research, Ben found CTM to be under 12 for controlled examples. These ranges indicate a high degree of manipulation for the collected data. Another interesting observation that we can make from the plots provided is that content generation is relatively low for dates after 24th march, but the CTM for English and Hindi increase after 24th march, which might indicate that the users that stopped tweeting were genuine users.
In the plot below, you can see three types of data points:
- Multiple small island clusters separate from the main island: The data points in these islands coincide, indicating that the same text was used for the tweets.
- One sparsely populated central island: These contain the majority of the points. These are the tweets that showed variation in text and cannot be considered as collusive.
- Dense areas on the central island: These are the regions with dense areas inside the central island. These regions indicate the tweets that were not very different from the rest of the corpus but are too similar. The content might be plagiarised or changed just a bit to avoid detection.
Pareto's Principle
The results obtained above are similar to Pareto’s principle which states that for many outcomes, roughly 80% of consequences come from 20% of the causes.
Here from the inferences, we can see that nearly 75% data on Twitter regarding the farmer's protest is contributed by nearly 17% user accounts only.
There are certain cases of extreme user accounts also who have been posting regularly 20+ tweets related to farmer's protest daily which doesn't look like a normal Twitter user account activity. These accounts indicate the possibility of ulterior motives and agendas other than raising the issues of farmer's protest on Twitter.
Conclusion
The study pertaining to engagement patterns helped us find out that a high degree of periodicity was observed among extreme users, which could be extended to the entire dataset. The periodicity could be one of the by-parts results of collusive tweeting.
Furthermore, manual annotation of tweets helped us identify the user's sentiments, leading us to a significant user's perspective regarding the agenda of farmers' protests. The result of manual annotation was that most of the content generated on Twitter was not the unbiased opinion of people with their willingness. Instead, most of the data was generated due to some specific people with a motive to persuade and influence people's free thoughts in farmers' protest's view. The similarity of the tweets was concluded with the help of clustering using a bag of words approach.
Finally, calculating the coefficient of traffic manipulation helped us justify our claim of a good amount of inorganics or coordinated activity from malicious users in the view of farmers' protest.


Comments
Post a Comment